You can pull a report from the system which will show you various information regarding the activities and usage on your platform. Having this data enables informed decisions to improve user experience and platform efficiency. Visualising the data helps identify improvement areas, successful features, and user behaviour, allowing effective resource prioritisation, targeted marketing, and strategic planning to align with user needs.
Further Detail
The report provides a comprehensive overview of user interactions with the system. It details the timeline of each user's activity, starting from the date they were initially invited to participate. Key metrics include the deadline, the precise moment they accepted the invitation, and the number of questions they have answered. Additionally, the report may encompass other pertinent information such as if the invitation was declined and when. This data serves to enhance user engagement tracking, and optimise the process by identifying patterns and areas for improvement.
How to Get Started
Firstly navigate to the 'Reports' section on the left-hand side and click the graph icon, as can be seen in the image below:
After clicking into the reports section we will see the following screen:
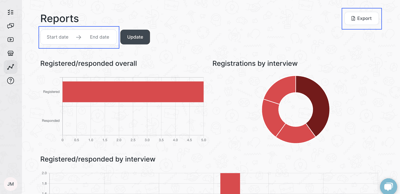
Here we can filter by specific dates by clicking the 'Start date' & 'End date' in the top-left corner as highlighted in the image above. Or if we leave the dates blank, this will run the report using the data as a whole. To produce your report click the 'Export' button in the top-right hand corner of the screen. This will then be emailed to you in CSV format.